
How to Understand Directly Proportional Graphs
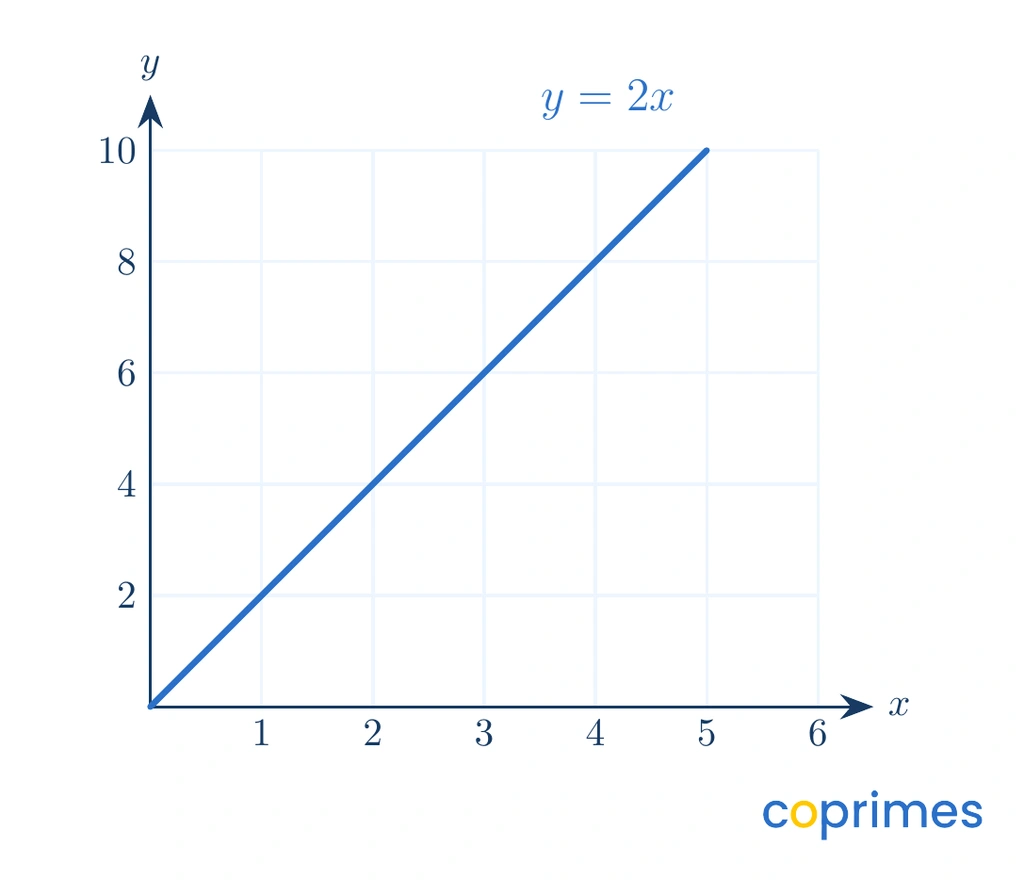
A directly proportional graph is a straight line through the origin. Its equation is , and the constant of proportionality is the amount changes for each one unit of .
What is a directly proportional graph?
A directly proportional graph visually represents two variables that increase or decrease at a consistent rate. This means that if one variable doubles, the other variable doubles exactly as well.
Two quantities that behave this way are described as directly proportional.
The algebraic relationship between the variables and is written as .
The value is known as the constant of proportionality. It tells you exactly how much increases for every single unit increase in .
A directly proportional graph always forms a straight line passing exactly through the origin.
Recognise the origin condition
For a graph to show direct proportion, it must satisfy two strict geometric conditions. First, it must be a perfectly straight line. Second, it must pass exactly through the origin, which is the coordinate point .
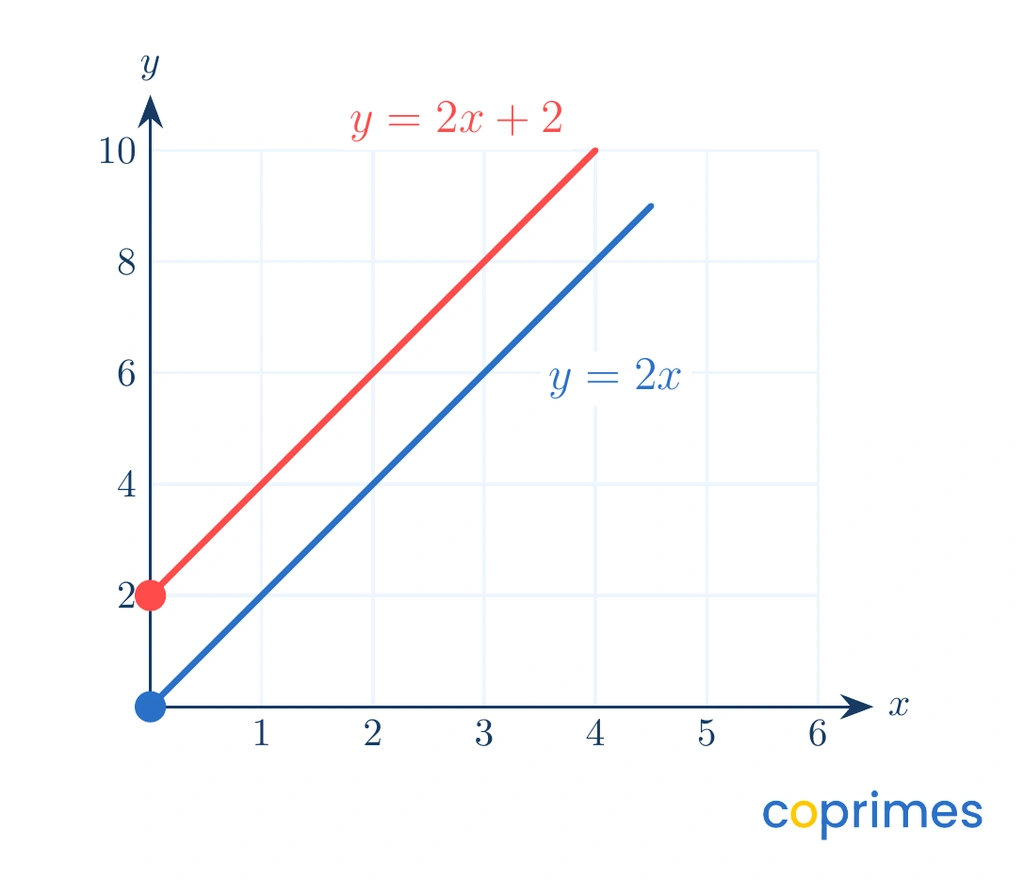
If a line is straight but intersects the y-axis at any number other than zero, the relationship is not directly proportional. Similarly, if a graph passes through the origin but forms a curve, it does not represent direct proportion.
Find k from a point
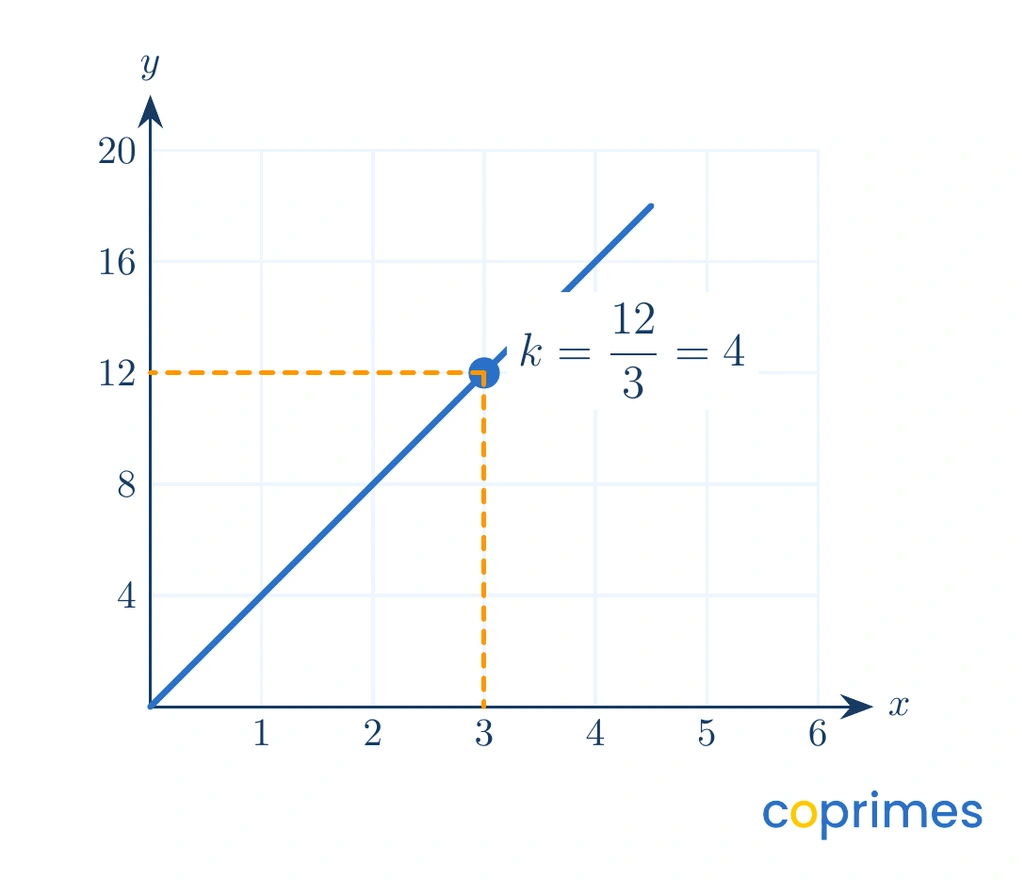
When you have a graph of a directly proportional relationship, you can find the constant by picking any clear point on the line other than the origin.
Because the core equation is , you can rearrange it to isolate . Divide the y-coordinate of your chosen point by its x-coordinate.
The constant is found by dividing the y-value by the x-value.
For example, if a proportional line passes through the point , you divide by . This means the constant is , and the full equation of the line is .

Graph y equals kx
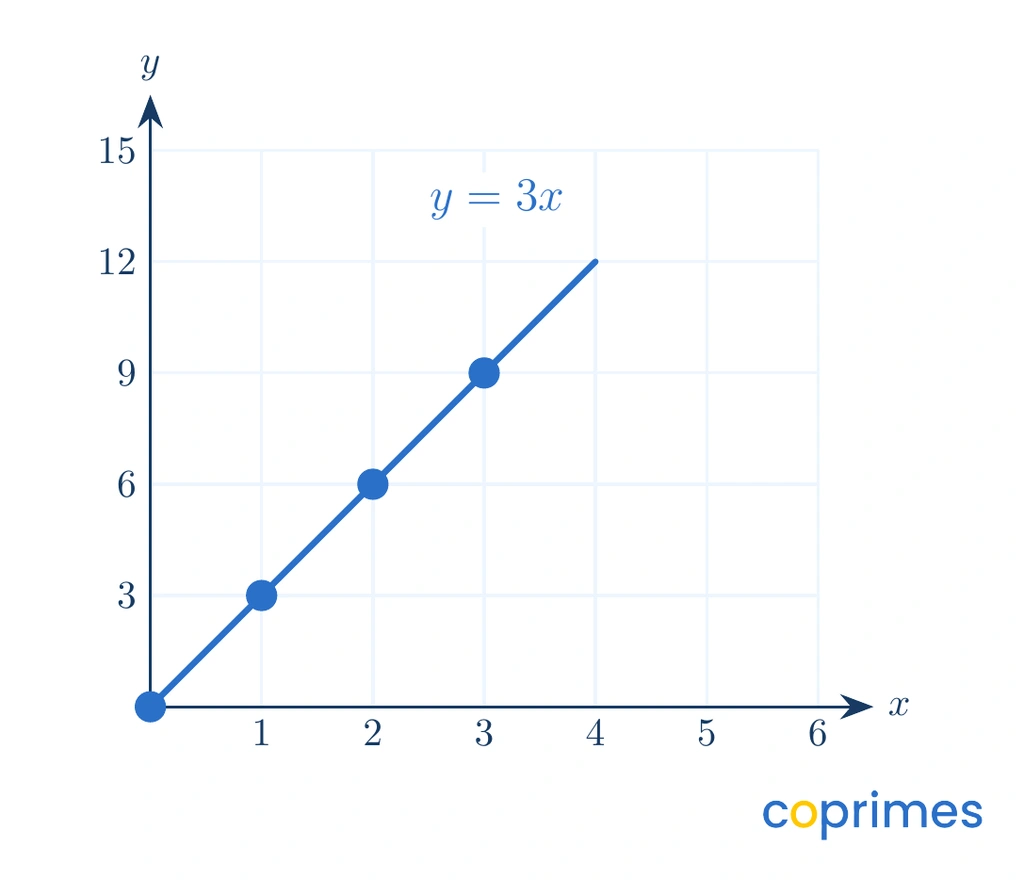
To graph a directly proportional relationship from an equation like , you should first create a table of values. Choose a few simple values for , multiply each by the constant to find the corresponding value, and plot the resulting coordinate pairs.
Point | ||
Because the graph represents direct proportion, one of your points will always be . You only need one or two additional points to draw an accurate straight line. Using ratio tables is an excellent way to organize these values before plotting them on a coordinate grid.
Compare proportional and non-proportional lines
Not every straight-line graph represents a proportional relationship. You will often need to compare proportional lines with non-proportional lines to identify the correct relationship.
A true proportion requires equivalent ratios across all points on the line. If a graph represents an equation like , the line is completely straight, but it crosses the y-axis at . Because it misses the origin, the ratio of to changes at different points, proving the relationship is not proportional.
Worked examples
Review these step-by-step examples to see how to apply the conditions for direct proportion.
Example 1: Finding the equation from a line
Question: A graph shows a straight line passing through the origin and the point . What is the equation of the line?
Method:
- Check that the line meets the origin condition. It is a straight line through , so it is directly proportional.
- Use the given point to find the constant of proportionality, .
- Divide the y-value by the x-value: .
- Write the final equation in the form .
Answer: The equation is .
Check: Substitute into your equation. . This matches the given coordinate point.
Example 2: Identifying the correct relationship
Question: A straight line passes through the points and . Is this a directly proportional graph?
Method:
- Identify the coordinates of the first point. The line crosses the y-axis at , not .
- Check the strict origin condition. For a graph to be directly proportional, it must pass exactly through .
- Because it misses the origin, the ratio of to will not remain constant.
Answer: No, the graph is not directly proportional because it does not pass through the origin.
Check: Calculate the ratio at , which is . If the relationship were truly proportional, the y-value at would be . Instead, the given point is , confirming it is not proportional.
A learning plan shaped by your child, not the class
State-aligned Math plus our own Logic and English curriculum. An adaptive baseline test finds the gaps and fills them.
Common mistakes
- Assuming every straight line is proportional: A straight line alone is not enough. The line must also pass exactly through the origin.
- Inverting the constant calculation: When finding , students often divide by . The correct formula is .
- Assuming a curve can be directly proportional: Even if a curve passes through the origin, a changing slope means the rate is not constant. Direct proportion must yield a straight line.
Frequently asked questions
Here are answers to common questions about direct proportion graphs.
Can the constant of proportionality be a fraction?
Yes, the constant can be any non-zero number, including fractions and decimals. For example, if , the graph is still a straight line passing through the origin. It simply rises less steeply than a graph where is a whole number.
What is the difference between direct and inverse proportion?
In a direct proportion, both variables increase or decrease at a constant rate, creating a straight line through the origin. In an inversely proportional relationship, one variable increases while the other decreases. This creates a distinctive curved graph that never touches either axis.
Practice questions
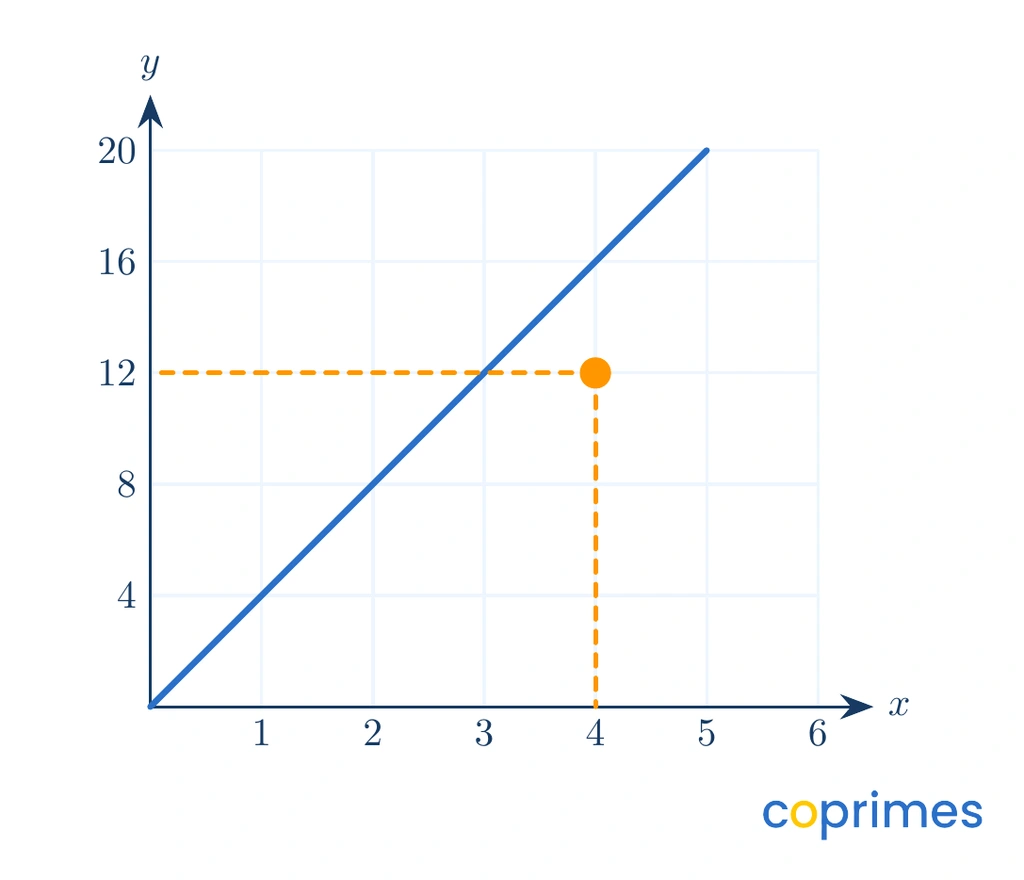
What is the constant of proportionality, , for the graph shown?
Which geometric condition must always be true for a directly proportional graph?
It forms a smooth curve.
It passes exactly through the origin.
It crosses the y-axis above zero.
It represents an inversely proportional relationship.
It passes exactly through the origin.
A directly proportional graph passes through the point . What is the equation of the line?
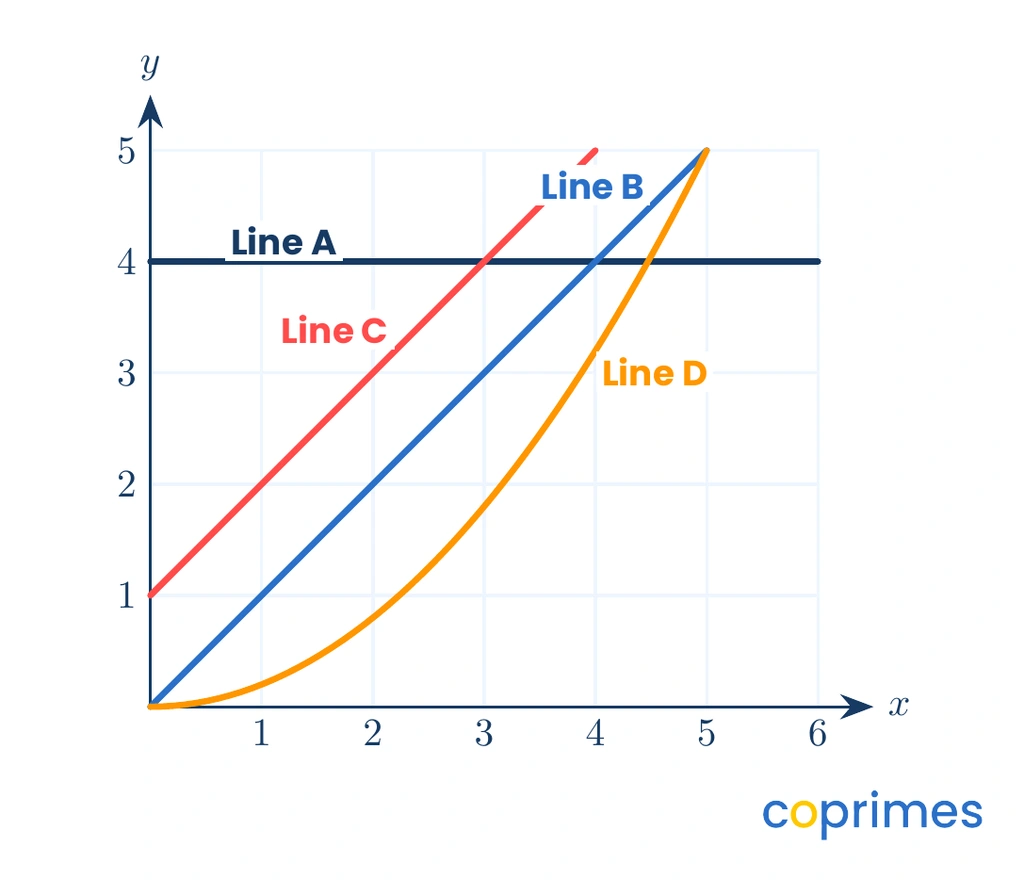
Based on the visual properties, which line correctly shows a directly proportional relationship?
Line A
Line B
Line C
Line D
Line B
If is directly proportional to , and when , what is the value of when ?