
Ratio Tables: Method, Examples, and Missing Values
A ratio table organises pairs or sets of equivalent ratios into a structured format. Each row or column must be scaled by the same factor so every entry preserves the original multiplicative relationship. This tool makes calculating missing values and comparing proportions clear and systematic.
Every valid table is built upon a foundational ratio that describes how two or more quantities relate to one another.
What is a ratio table?
A ratio table is a chart that displays a sequence of proportional relationships. The table is structured in rows and columns, where each column or row represents the same ratio scaled by different amounts.
Because they list equivalent ratios, ratio tables function similarly to double number lines but offer a more compact way to organize data. They are especially useful for finding unit rates, scaling recipes, or converting measurements.
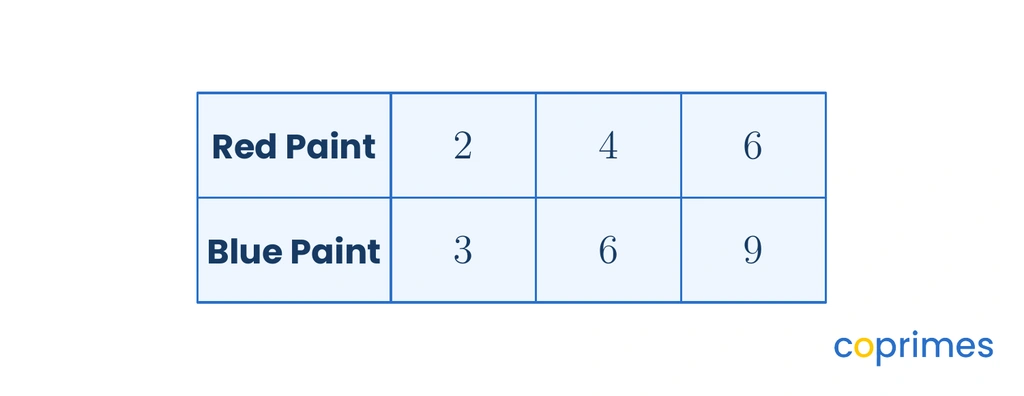
Tables can be arranged horizontally, where the categories are listed in the leftmost column, or vertically, where the categories form the top headers. Both layouts preserve the exact same mathematical information.
Build a ratio table
To construct a ratio table from a given relationship, follow a sequence of structured steps. The table can be expanded infinitely as long as the initial proportion is maintained.
- Identify the categories being compared and write them as the headers.
- Enter the original ratio into the first set of empty cells.
- Choose a multiplier to scale the ratio.
- Multiply every part of the original ratio by the chosen multiplier to create the next entry.
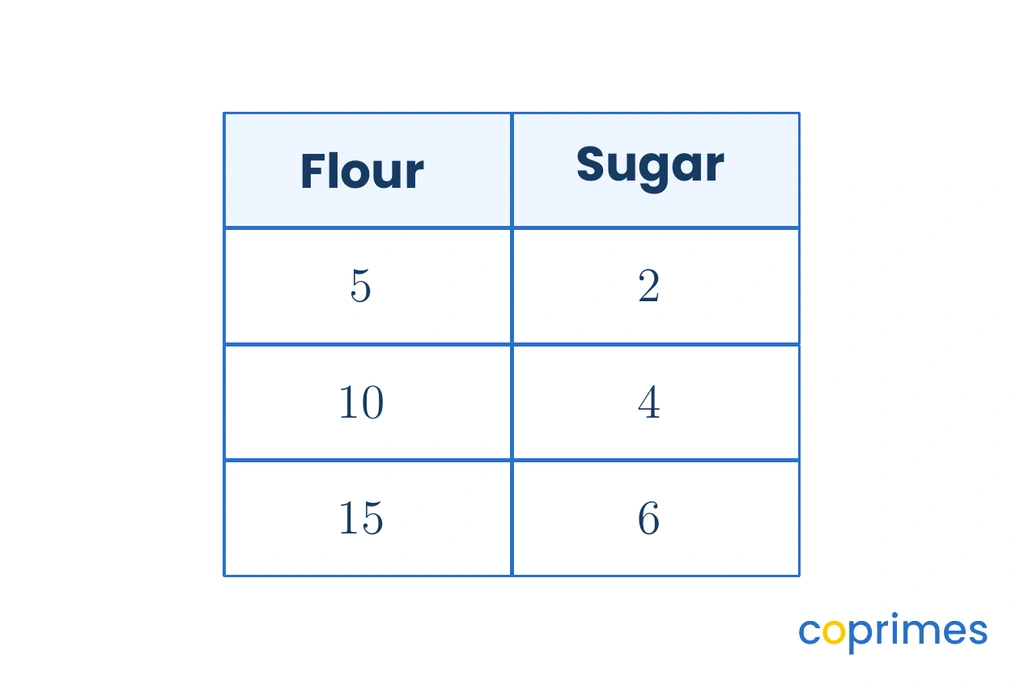
The values do not have to increase sequentially. A table can jump directly from a small ratio to a much larger one, provided the multiplicative relationship remains intact.
Scale every part by the same factor
The single most important rule when working with ratio tables is that every component must be scaled by the same factor. This process is identical to creating equivalent fractions or simplifying ratios.
Always multiply or divide by the scale factor. Never add or subtract to find the next column.
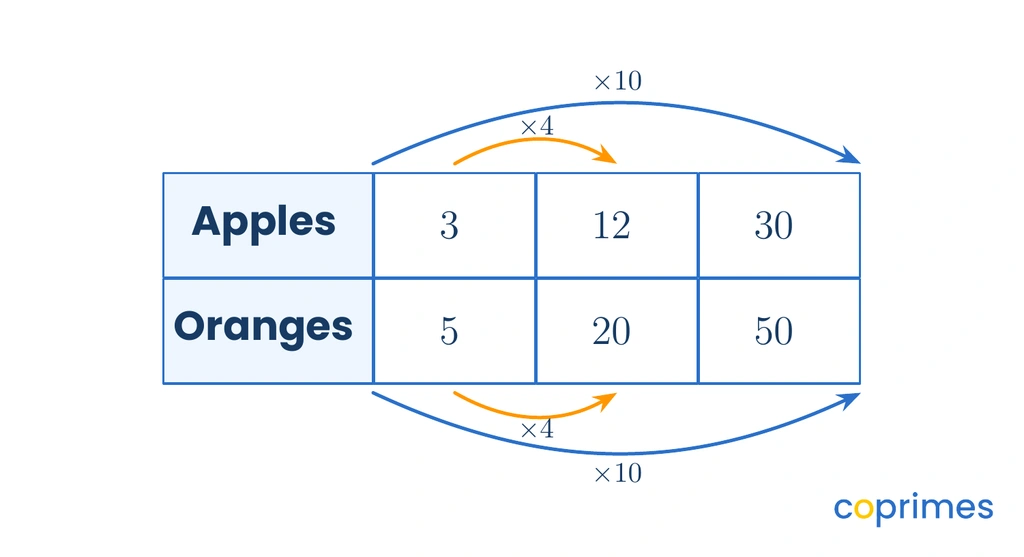
If one quantity is multiplied by , the matching quantity must also be multiplied by . Division operates identically; reducing a ratio by dividing every part by the same number ensures the relationship remains balanced.
A learning plan shaped by your child, not the class
State-aligned Math plus our own Logic and English curriculum. An adaptive baseline test finds the gaps and fills them.
Find missing values
Ratio tables excel at determining unknown quantities. When an exact multiplier is not immediately obvious, intermediate steps can bridge the gap.
To find a missing value, determine what operations transform the known entry into the target entry. Sometimes, it is easier to divide down to a unit rate (a value of ) before multiplying up to the desired amount.
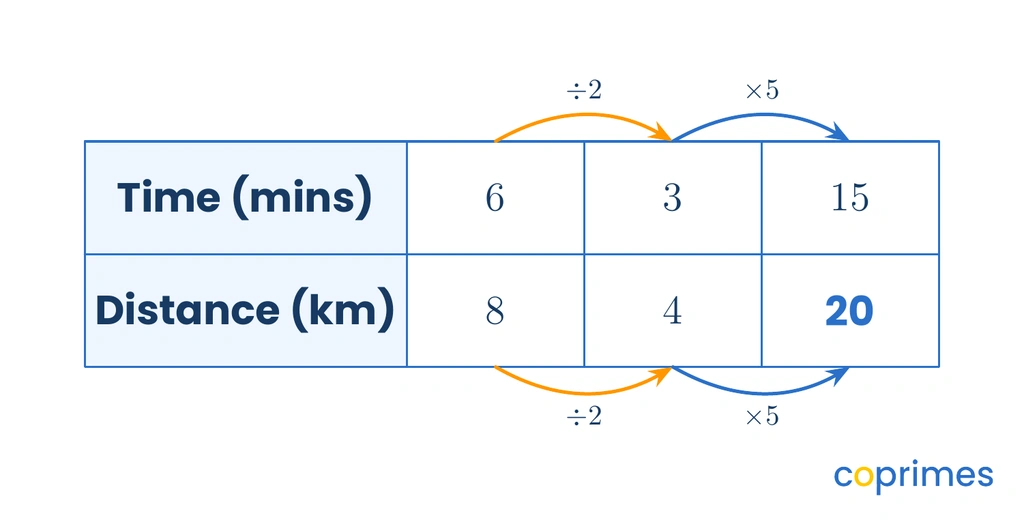
In the example above, scaling directly from to requires multiplying by . By inserting an intermediate column and dividing by first, the subsequent multiplication by becomes much simpler to calculate.
Use ratio tables to compare relationships
Creating two separate tables is an excellent strategy for comparing ratios. To decide which of two mixtures is stronger or which vehicle is faster, expand both tables until they share a common value in one of the categories.
Once a category is equalized across both tables, the secondary quantities can be compared directly. This acts much like finding a common denominator for fractions. If tables feel difficult to visualize, bar models can also represent these comparisons effectively.
Worked examples
Reviewing problems step by step clarifies how multipliers operate across different contexts.
Example 1: Expanding a ratio table for ingredients
Question: A bakery makes cookies using a ratio of cups of flour to cups of oats. How many cups of oats are needed if the baker uses cups of flour?
Method:
- Set up a ratio table with Flour in the top row and Oats in the bottom row.
- Place the original ratio, and , into the first column.
- Place the target amount, , into the Flour row of the next column.
- Determine the scale factor connecting the known values: .
- Multiply the matching category by the same scale factor: .
Answer: The baker needs cups of oats.
Check: Simplify the new ratio by dividing both numbers by . This produces the original ratio of to .
Example 2: Using intermediate steps to find a missing value
Question: A machine prints pages in seconds. How many pages does it print in seconds?
Method:
- Construct a table with Pages and Seconds. Input the known ratio: pages and seconds.
- Observe that does not multiply neatly into the target time of .
- Create an intermediate column by finding a common factor for and , which is .
- Divide both numbers in the original ratio by to reach the intermediate time of seconds: pages.
- Multiply both numbers in this intermediate ratio by to reach the target time of seconds: pages.
Answer: The machine prints pages in seconds.
Check: Calculate the unit rate by dividing pages by seconds, which equals pages per second. Multiplying pages per second by seconds yields pages.

Common mistakes
When errors occur in proportional reasoning, they often stem from these specific misunderstandings:
- Adding instead of multiplying: The most frequent error is applying additive reasoning rather than multiplicative reasoning. If one column increases from to , a student might mistakenly add to the paired value instead of multiplying by .
- Scaling categories by different factors: Multiplying the top row by and the bottom row by destroys the equivalence of the ratio. Every part of a single column must receive identical treatment.
- Misaligning categories: Placing a value for "Distance" into the "Time" row leads to incorrect calculations. Always double-check column and row labels.
Error check: If a table calculates 4 to 8 becoming 8 to 12, additive reasoning was incorrectly used (+4).
Frequently asked questions
Can a ratio table go backwards?
Yes. Moving left across a ratio table or scaling down requires division instead of multiplication. This is commonly used to find the simplest form of a ratio.
Are ratio tables and fraction tables the same?
They function using identical arithmetic rules. Finding equivalent ratios uses the exact same scaling process as finding equivalent fractions.
Can a table have more than two rows?
Yes. If a recipe combines flour, sugar, and butter, the table will have three rows. All three rows must be multiplied or divided by the same scale factor simultaneously.
Practice questions
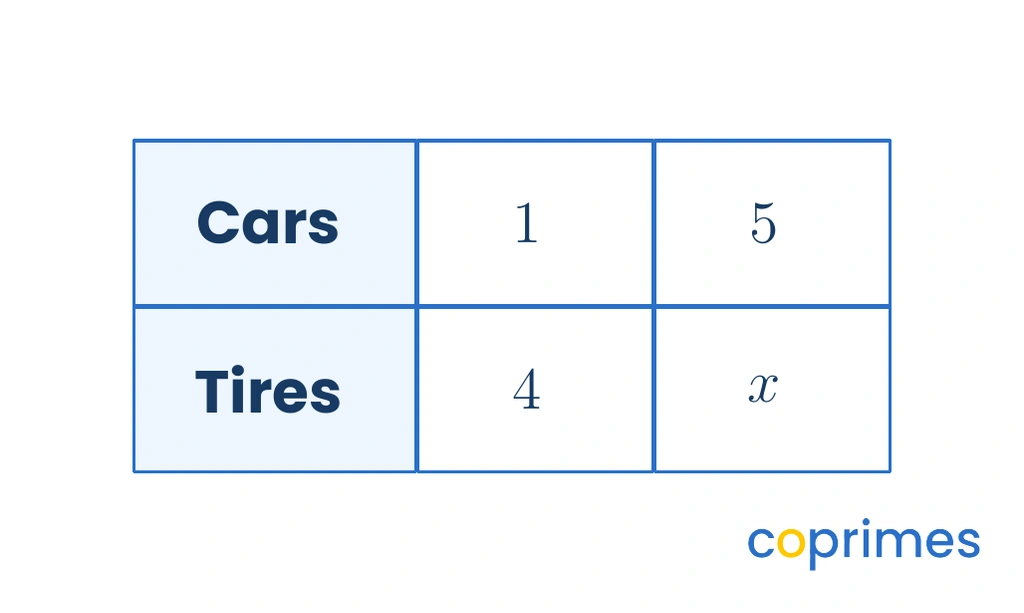
Based on the proportional relationship shown in the table, what is the value of ?
A table tracks a recipe requiring eggs for every cups of flour. If a baker uses cups of flour, which multiplier should be applied to find the required number of eggs?
A train travels at a constant speed, covering kilometres in hours. Using an intermediate step in a ratio table, how far does the train travel in hours?
kilometres
kilometres
kilometres
kilometres
kilometres
A student evaluates a table where the first column is to . The student writes the next column as to . Which common proportional mistake did the student make?
The student added a constant amount instead of multiplying.
The student scaled each category by a different multiplier.
The student placed the variables in the wrong rows.
The student used subtraction instead of division.
The student added a constant amount instead of multiplying.
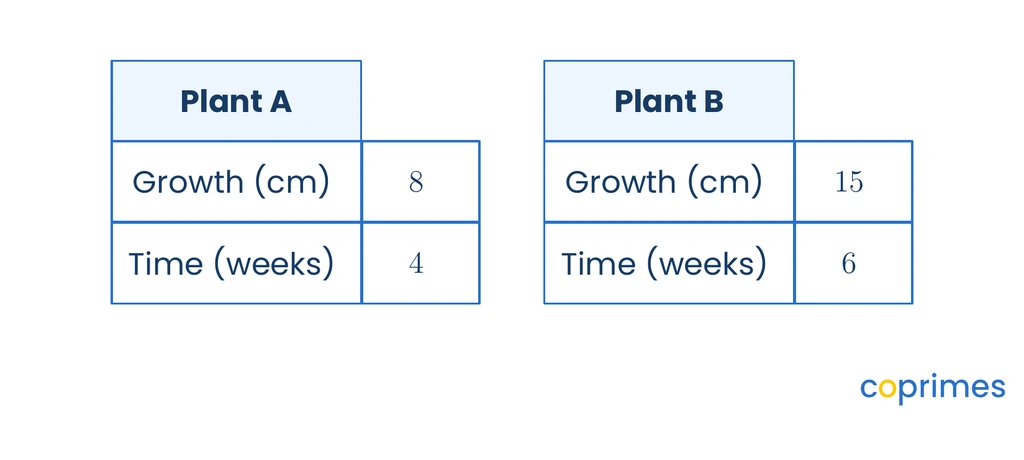
By expanding both tables to a common timeframe of weeks, which statement is true?
Plant A grows more quickly, reaching cm in weeks.
Plant B grows more quickly, reaching cm in weeks.
Plant B grows more quickly, reaching cm in weeks.
Both plants grow at the exact same rate.
Plant B grows more quickly, reaching cm in weeks.